The Problem
Industry and Business need Statistics for their survival and development. Being this an axiom difficult to contradict, and having the statistical software R had an impressive increase of use1, it would be expected that statistical methods for quality control and improvement had had a similar evolution. However, even though some companies are starting to use R for those methods, there is a long way to attain the usage and confidence standard commercial tools have reached2. Actually, in many companies R is being used thanks to a handful of R-enthusiastic practitioners working there.
Statistical methods for quality control and improvement are basically general statistical methods applied to industry. Thus, the use of base R in industrial environments should be natural, as the R software applied to industry standards provides the flexibility to implement new methods quickly, and could not only mimic the standard commercial software, but improve it, speeding up innovation. However, R face the same drawbacks that other business applications. On the one hand, the lack of a sort of seamless Graphical User Interface (GUI) for standardised tasks is a barrier to use R by non-statistically-skilled professionals. We know that this is not optimal (one should know what the software does, not just click and see), but it is also true that, in many cases, the statistical tools are just standardised procedures and it is enough for the sake of the business to interpret the outputs by some engineer, manager, or alike, given the correct input. On the other hand, the specifics of the quality control methods, for example related to the way things are named, or how to present the results, it is often needed to adapt the base functions in order to present the results in an understandable way for the experts in the matter. Sometimes this is very easy just writing a function that wraps base functions. Other times, more complex software development is needed, for example via R packages.
Some packages
that cover some quality control and improvement topics are available at CRAN.
The qcc
package [1] is probably the first contact a quality control practitioner has with R.
Its functions to produce quality control charts are well valued by
practitioners (see Fig. 1). Other R packages like qualityTools [2],
qcr [3], qicharts [4], SixSigma [5],
or AcceptanceSampling [6], among others,
are available for different quality control and improvement tasks.
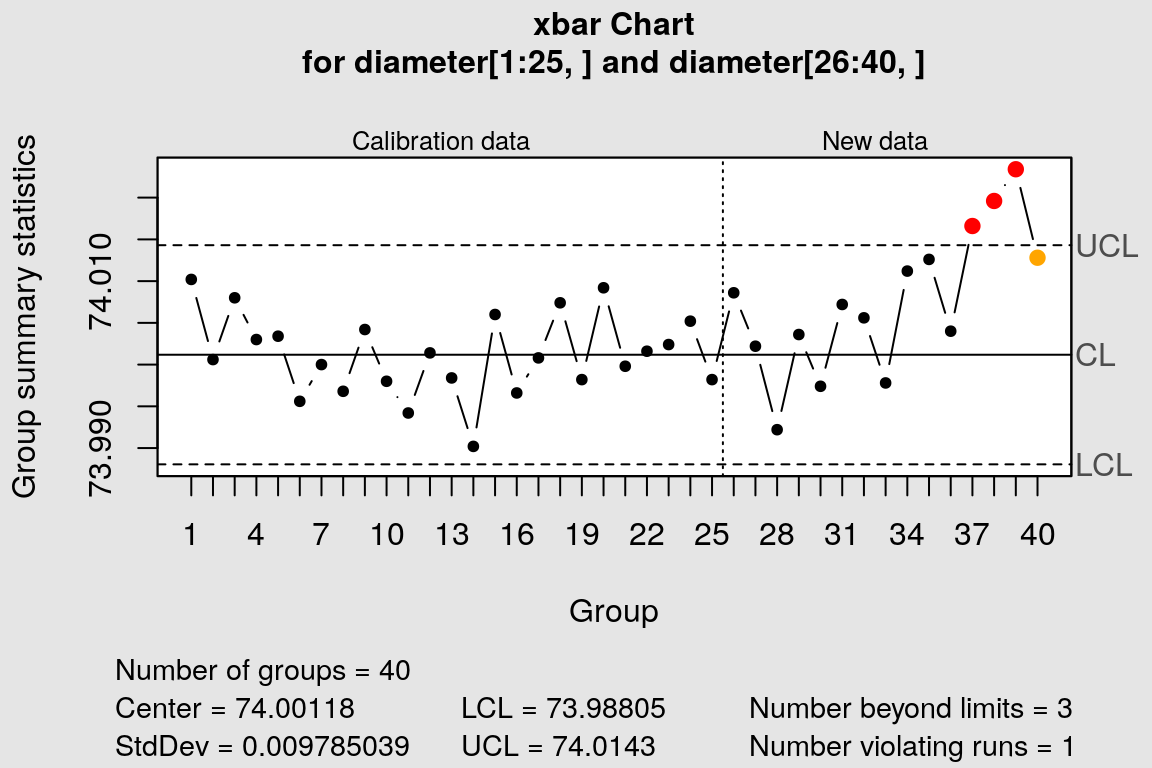
Figure 1: A control chart produced with the qcc package.
The seminal idea for this proposal actually arose in 2011 from my interest
on the topic during my Masters Studies. The Masters thesis [7]
paved the way for a continuous work on the topic since then, including a
non-stopping learning about the real needs of industry. A manuscript entitled
“An Introduction to Six Sigma Tools With R” was submitted to the R Journal.
It was rejected, but,
far from being discouraging, that provided new inputs and insights for further
work. In fact, the rejected paper became a chapter of the book “Six Sigma with R”
[8] published later together with
the SixSigma package.
Some of the comments by one of the anonymous reviewers provided relevant
input for this project3. At the beginning, this review puzzled us the authors as R enthusiasts.
But during the subsequent years
working on the topic, I eventually think that something must be done from the
R ecosystem to convince industry.
Industry works with Standards, rather than with text books. The software developed for industry should take into account industry standards. Ideally, computational statistics developers should participate in the development of statistical standards. Thus, the aim of this project is to build the needed R Infrastructure with the language and procedures of industry, i.e., the Standards. Moreover, the RISSQ will help industry in the verification process, i.e., verify that the software does what the Standards say. By two means: through the Open Sourced code, and through the automatic verification of the numerical examples in the Standards.
The Plan
The RISSQ project was proposed twice to the Infrastructure Steering Committee (ISC) of the R Consortium looking for funding for its development. The ISC supports projects that broadly help the R community. This support might be software development, developing new teaching materials, documenting best practices, promoting R to new audiences, standardising APIs or doing research. This proposal tackles several of those topics, and Statistical methods for quality control and improvement is a topic in which commercial software is still dominant. This project could be relevant for spreading R among industry and business by filling the existing gaps. International standards, well known and accepted by the industry, will be a catalyst for adopting R. However, the proposal did not convince the committee that the project would impact a sufficiently broad segment of the R Community.
Nontheless, the project is clearly of interest for companies and practitioners.
Industry users of the SixSigma package have sent feedback supporting the project,
and a letter of interest was sent by Philips Lighting4. The project has also being outlined in several presentations5 receiving encouraging comments. Check the updated list of supporters. Thus, I have decided to start the project with my own resources (mainly, time and will) and the aid of internship students (unpaid, until funds come). Check the updated list of contributors. Next, the inital work plan is shown, even though we are running the project in a sort of freestyle.
The work plan is organised in 4 Work Packages (WP) with disaggregated tasks. All WPs finish in verifiable Milestones. The project is planned to be completed in two years (M1–M24). The Gantt Chart below summarizes the timing.
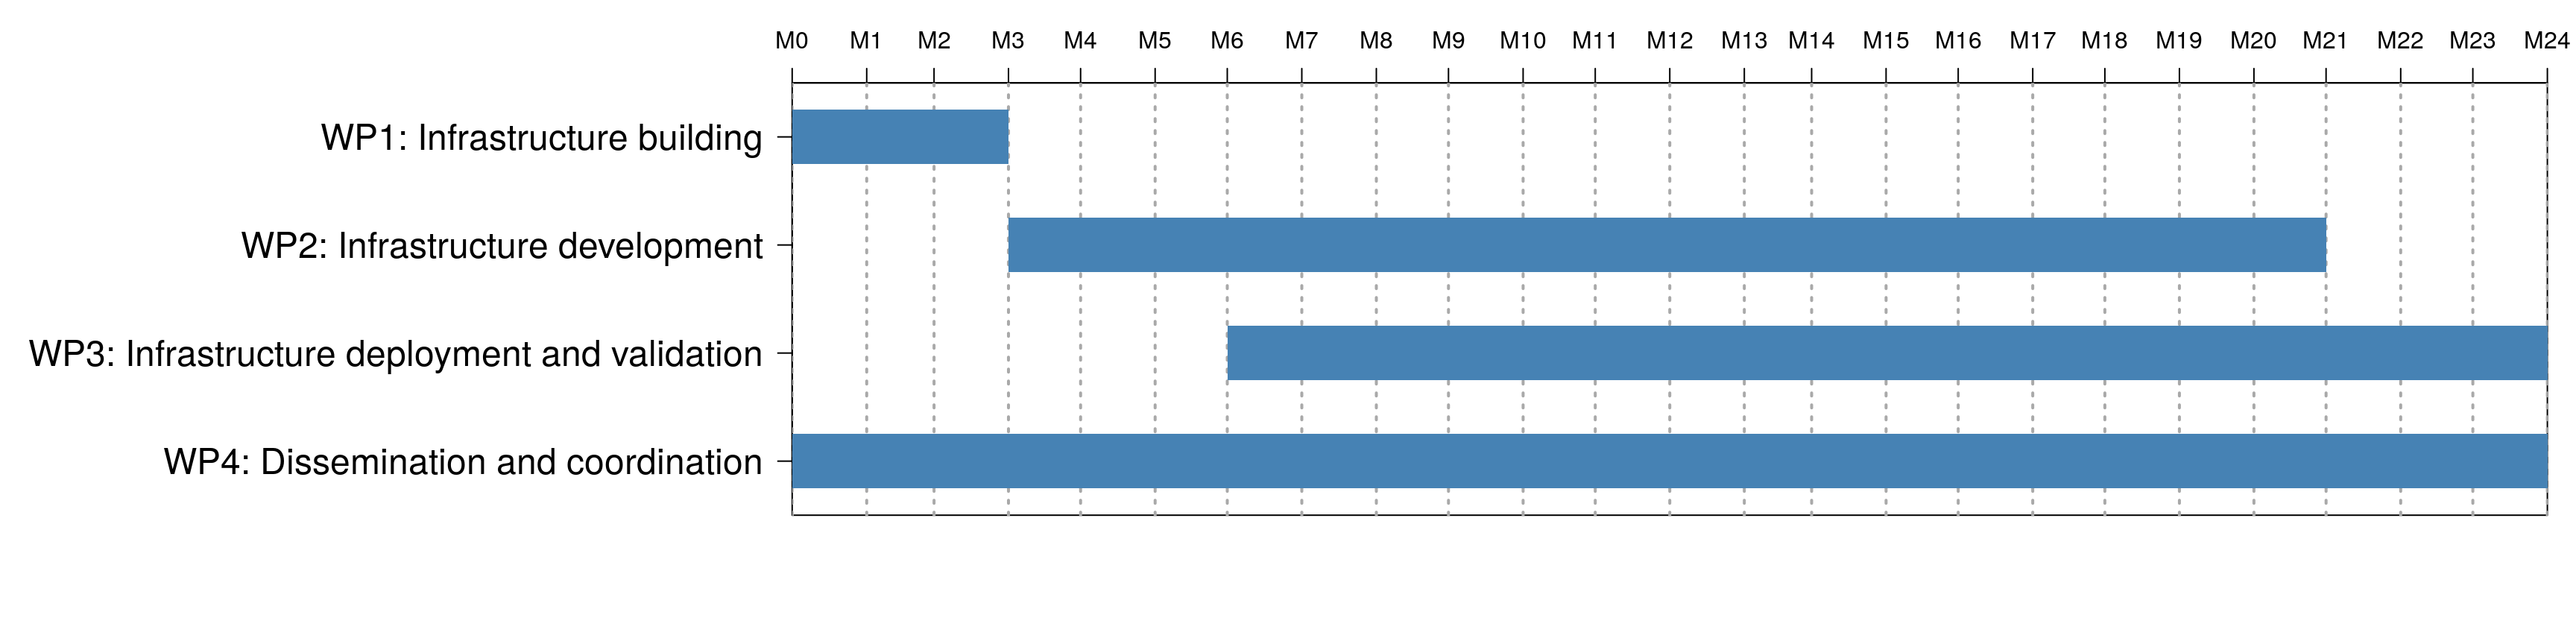
In summary6, the project starts gathering the “Standards Library”, i.e., the identified international standards from ISO Technical Committee 69 (Applications of statistical methods) and AIAG (Automotive Industry Action Group) containing methods to be implemented in R, e.g., (number of documents in parenthesis): AIAG MSA (Measurement Systems Analysis) and SPC (Statistical Process Control) Manuals (2); ISO 7870 series, control charts (9); ISO 22514 series, capability analysis (9); ISO 5725 (5), 11648 (2) and 11843 (7) Series, Measurement methods and results (TC 69/SC 6), Acceptance Sampling (TC 69/SC 5). Then, before implementing methods, the basic infrastructure is to be developed, i.e., a git project, the data structures, classes, functions common features, verification process, a Shiny App and a website. Next, in WP2, the methods in the Standards are to be implemented, sequentially by group (control charts, capability analysis, and measurement systems analysis). The validation and deployment carried out in WP3 is done after each group of standardised methods is developed. Finally, WP4 tasks assure the project coordination and dissemination.
The RISSQ will be developed under the R paradigm of providing easy ways of producing results with few options, scaling to more elaborated results via options and parameters. Thus, based on the basic infrastructure outlined above, low-level functions will contain the implemented standardised methods. When not in contradiction with the standards, already existing functions in the R base distribution will be recycled. This will result on an API that can be consumed: (1) by the RISSQ shiny App, which will be used not only for demonstration, but also as an in-house downloadable solution, And customizable by R experts and/or companies; and (2) by third parties, developers, and companies that want to build new solutions upon the base layer of the infrastructure. In addition to the people directly involved (see below), a group of stakeholders7 are willing to collaborate with the project providing real data sets and feedback. Table 1 shows a summary of the tasks to be carried out8.
| Task | Task title | starts | ends | hours |
|---|---|---|---|---|
| T1.1 | Standards’ Library building | M1 | M1 | 21 |
| T1.2 | Configure R Studio project, github repo, mail list, and webpage | M1 | M1 | 23 |
| T1.3 | Implement quality data standard | M1 | M1 | 30 |
| T1.4 | Define and document classes and generic methods | M1 | M2 | 58 |
| T1.5 | Define and document standards’ verification process | M2 | M3 | 82 |
| T1.6 | Define and document functions common structure | M2 | M3 | 53 |
| T1.7 | Build shiny basic demo | M3 | M3 | 48 |
| T2.1 | Implementation of Control Charts Standards | M4 | M6 | 350 |
| T2.2 | Implementation of Capability Analysis Standards | M7 | M9 | 308 |
| T2.3 | Implementation of Measurement Systems Analysis Standards | M10 | M14 | 520 |
| T2.4 | Implementation of Acceptance Sampling Standards | M15 | M19 | 513 |
| T2.5 | Analysis and Implementation of other techniques Standards | M20 | M21 | 171 |
| T2.6 | github major releases (at least for each group) | M4 | M21 | 48 |
| T3.1 | Validation of implemented methods | M7 | M24 | 360 |
| T3.2 | Releases to CRAN | M8 | M24 | 120 |
| T3.3 | Shiny UI design for each method (validation) | M10 | M24 | 66 |
| T3.4 | Shiny UI design for each method (new data) | M11 | M24 | 66 |
| T3.3 | Minor Releases to github | M21 | M24 | 16 |
| T4.1 | WP1 Training and coordination | M1 | M3 | 154 |
| T4.2 | WP1 reporting and dissemination | M4 | M4 | 20 |
| T4.3 | WP2 training and coordination | M4 | M21 | 231 |
| T4.4 | WP2 reporting and dissemination | M7 | M21 | 102 |
| T4.5 | WP3 training and coordination | M7 | M24 | 168 |
The more likely failure mode for the project is not getting funded.
In the event of the lack of resources, I will continue developing the SixSigma
package trying to implement the standards approach9
along with the users feedback.
Apart from that, the project can
be threaten by the insufficient expertise of the researcher to be contracted.
In that case, I will allocate more hours from my time for training and development.
Finally, some intellectual property issues could arise. I will mitigate this
risk by checking with the standardisation committee I am involved each new version.
The resources needed for the project are gathered in Table 2. Two roles will participate in the work: Senior Researcher (SR) and Junior Researcher (JR). SR planned work will be mainly done by the project leader, with the support of the research group team at UCLM10. A pre-doc contract will be offered for contracting a PhD Student to do the JR planned work before the stay at Philips Lighting. The offer will be disseminated over the R Community, with special emphasis to R-Ladies groups, as we are committed with the gender gap. Dissemination is an important topic for the success of the project. We plan to attend, not only R/Stats conferences, but also Standards/Industry events, which will be crucial for the adoption of the infrastructure. Indirect costs complete the project budget, according to the rules of the University of Castilla-La Mancha11
| Resource | Year1 (EUR) | Year2 (EUR) | Total (EUR) |
|---|---|---|---|
| ISO TC69 Standards subscription | 2700 | 3250 | 5950 |
| AIAG Manuals acquisition | 300 | 0 | 300 |
| Shiny server | 440 | 440 | 880 |
| github | 0 | 0 | 0 |
| Development laptop | 1099 | 0 | 1099 |
| Senior researchers | 7274 | 4728 | 12001 |
| junior researcher | 15757 | 15757 | 31514 |
| R/Stats conferences | 1000 | 3000 | 4000 |
| ISO/Industry events | 1000 | 3000 | 4000 |
| Total direct costs | 29570 | 30175 | 59745 |
| Indirect costs (21%) | 6210 | 6337 | 12546 |
| Total cost | 35780 | 36512 | 72291 |
Non-financial support is also welcome. Beyond the dissemination to the R ecosystem, it is important for the project success to reach industrial stakeholders. A first and easy step is bringing the project to the attention of companies that already are with R12. Another possible contribution would be to support the participation in the standardisation committees. In particular, the R community could be represented in the Technical Committee ISO/TC69 (and subcommittees) not only to implement the standards on the software, but also to contribute to the establishment of sound statistical standards for industry.
Dissemination
The project will be public at github13. The licence for this project will be the same as the one for R itself. A website, mailing list and twitter account will be setup. Blog posts will be sent to the R Consortium blog, and sent to relevant stakeholders14. The results will be explained in publishable working papers15. The results of the project will be presented at international conferences16.
References
[1] L. Scrucca, Qcc: Quality control charts, 2014. https://CRAN.R-project.org/package=qcc.
[2] T. Roth, QualityTools: Statistical methods for quality science, 2016. https://CRAN.R-project.org/package=qualityTools.
[3] M. Flores, Qcr: Quality control review, 2016. https://CRAN.R-project.org/package=qcr.
[4] J. Anhoej, Qicharts: Quality improvement charts, 2016. https://CRAN.R-project.org/package=qicharts.
[5] E.L. Cano, J.M. Moguerza, M. Prieto, A. Redchuk, SixSigma: Six sigma tools for quality control and improvement, 2018. https://CRAN.R-project.org/package=SixSigma.
[6] A. Kiermeier, AcceptanceSampling: Creation and evaluation of acceptance sampling plans, 2016. https://CRAN.R-project.org/package=AcceptanceSampling.
[7] E.L. Cano, An introduction to quality control with R, Master’s thesis, Rey Juan Carlos University, 2011. http://eciencia.urjc.es/handle/10115/5794.
[8] E.L. Cano, J.M. Moguerza, A. Redchuk, Six sigma with r. Statistical engineering for process improvement, Springer, New York, 2012.
[9] E.L. Cano, J.M. Moguerza, M. Prieto, Quality control with r. An iso standards approach, Springer, 2015.
Not only in research and academic environments but also in practical applications.↩
Nowadays, Minitab© is probably the favourite for practitioners and trainers.↩
(…) The author ends stating that the advantage of R is the adjustability and the possibility to adjust the procedures by changing parameters. Unfortunately, Quality Management and Six Sigma in a classical notion are methodologies where companies rely for most of the time on heavily standardized procedures that where developed decades ago. It should also be mentioned that there are many companies with Six Sigma initiatives and certification according to ISO 9001:2008. The latter requires verified software as section 7.6 of ISO 9001:2008 states: ‘Confirmation of the ability of computer software to satisfy the intended application would typically include its verification and configuration management to maintain its suitability for use’. Minitab for instance implements strictly according to MSA Manual and ISO’s as well as other company guidelines such as VDA (German Association of the Automotive Industry) ed. 5. In addition, Minitab (de facto standard) subsumes the relevant methods under the term Quality Tools with Six Sigma being just the current project management philosophy.↩
Includes an offer to host a student in the company to work in the project.↩
See ENBIS-18 and free webinar presentations.↩
Details are not provided in this document. Nevertheless, a complete plan with the tasks details (description and hours per role and month) has been prepared.↩
Including academic researchers and industrial practitioners from companies like Philips (NL), Honeywell (USA), or u-blox (CH). A list with contact details is part of the full project plan.↩
The first digit of the task code is the WP number.↩
This can take ages, but I will not give up.↩
Include the authors of the R
adabagpackage (Esteban Alfaro, Matías Gámez and Noelia García) and José Luis Alfaro (quality control researcher).↩All costs are based on actual numbers and rules at the University of Castilla-la Mancha. A total of 3500 hours in the tasks tables above are split into 3072 for JR and 528 for SR.↩
In the list of R Foundation Members & Supporters there are companies as AT&T, eoda, or Shell that are very likely interested in the results of this project. Examples of other companies that might be interested and could be contacted are Toyota, General Electric, or Airbus, just to mention some of the more relevant ones. Ideally, AT&T would be a sort of “patron” of this project as the “father” of both R and modern Quality Control [9].↩
Except documents protected by intellectual property.↩
Including The World of Statistics (http://www.worldofstatistics.org/)↩
At least two, to be eventually submitted to the R Journal.↩
(1) R conferences, e.g., use R!, rstudio::conf. (2) Conferences related to statistical methods for quality control and improvement, e.g., ASQ conferences (Quality and Improvement or Six Sigma and Lean); AIAG Events; ENBIS conferences (European Network for Business and Industrial Statistics); INFORMS Annual Meeting (http://www.informs.org).↩